Oak Ridge National Lab · ORNL.GOV
How might we rebuild a national lab's public face — for the people who read it & write it?
ORNL.gov is the public front door to a national lab: the site that shapes how sponsors, policymakers, media, and the scientific community understand the lab's work. I led the research for its redesign and CMS migration, starting before anyone had agreed what the site was for. Analytics showed a site attracting real traffic and converting almost none of it, so I used that data to force the harder question of who ORNL.gov actually serves. Then I designed a workshop that turned the answer into an information architecture, tested the result, defined the KPI framework the program is measured against, and studied the internal content editors nobody had thought to ask about. Redesigns are easy to declare successful. I made sure this one could be proven.
BY THE NUMBERS
- 500+CMS fields inventoried & clustered to expose functional duplication
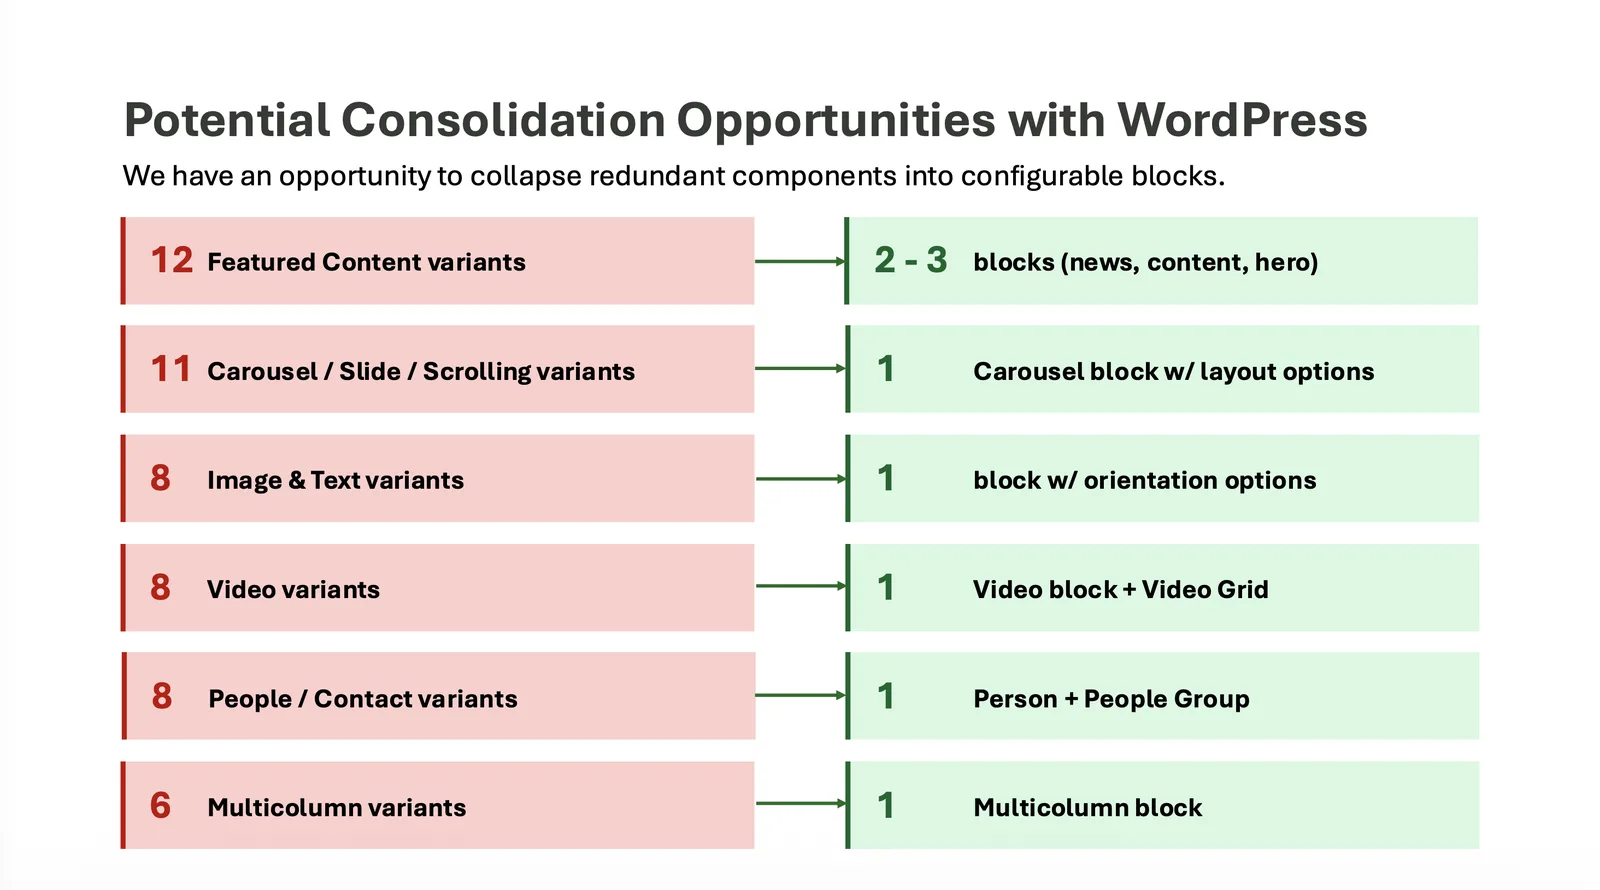
- 90 -12Content block types before & after my recommended. consolidation
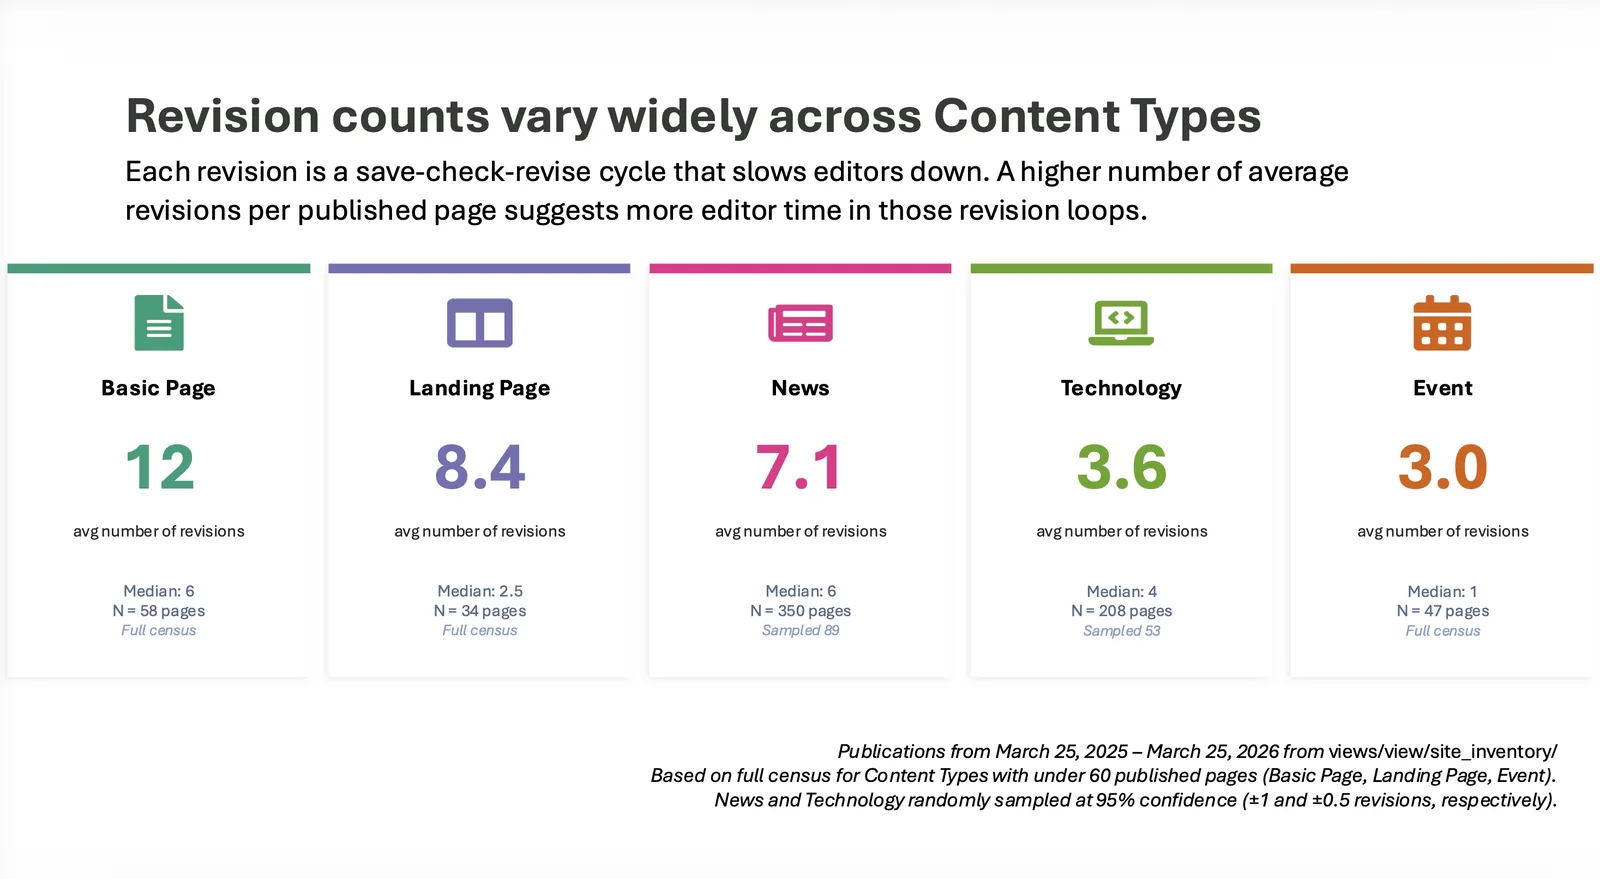
- 4,000+Editor revision cycles counted across a year of publishing (to set the pre-migration baseline)
- DATE
- Fall 2025 -
- ORGANIZATION
- Oak Ridge National Laboratory
- ROLE
- ResearchStrategyAnalytics & quantitative analysisMeasurement & KPI designInformation Architecture
- DELIVERABLES
- Site analytics audit & strategic reframe, audience prioritization framework, cross-directorate IA workshop, KPI framework mapped to divisional metrics, multi-round usability and navigation testing, contextual inquiry program with content editors, CMS complexity and revision-log analyses, pre-migration measurement baselines, block library consolidation strategy
Research Process: Setting the Strategy
- 01
Reading the Site Before Redesigning It
I audited the existing site's analytics: traffic sources, entry and exit behavior, heatmaps, scroll maps, device and geography splits, and visit duration. We learned many things about how people were (not) using the site as intended. My conclusion was that the homepage was functioning as a news billboard rather than a gateway to tasks, and that the site's real problem wasn't visual.
- 02
Forcing the Audience Question
Analytics surfaced that ORNL.gov was serving internal staff and external communications goals simultaneously, and doing neither well. Rather than recommend a design, I built an audience prioritization framework — each audience mapped against their actual goals, their priority to the lab's mission, how well the current site supported them, and the specific gap. That gave leadership a structured decision to make instead of an abstract debate, and they made it: sponsors, researchers, and job seekers became the primary audiences, with internal tooling explicitly scoped out and redirected.
- 03
IA Workshop
I designed a cross-directorate workshop to build the site's first-draft information architecture, because the structure had to be owned by the people whose work it organized. I wrote the facilitation plan around the political reality: at a national lab, a topic-based architecture cuts across directorate boundaries, and whose work appears where is a live question. Small groups mapped the lab's highest-priority search terms onto candidate focus areas, then matched directorates to each, then sketched a landing page for the areas they claimed and presented it back. The presentations revealed recurring subtopics, cross-topic conflicts, and ownership disputes. I synthesized the outputs into a keyword-to-topic matrix, a directorate-to-topic matrix, and an ownership matrix naming stakeholders and content contributors per focus area, which fed directly into prototyping and nav-label testing.
- 04
Making Success Measurable
I also came out of stakeholder alignment sessions with a whiteboard full of legitimate but unmeasurable ambitions: users find what they need, we become the standard for how DOE labs present information. I synthesized that into a five-category KPI framework covering speed of delivery, stakeholder satisfaction, risk mitigation, strategic impact, and operational health. Each metric got a definition, a collection format, and a mapping to KPIs our division already reported.
Research Process: Testing with Sponsors & Users
- 05
Testing the Audience Assumption with Sponsors
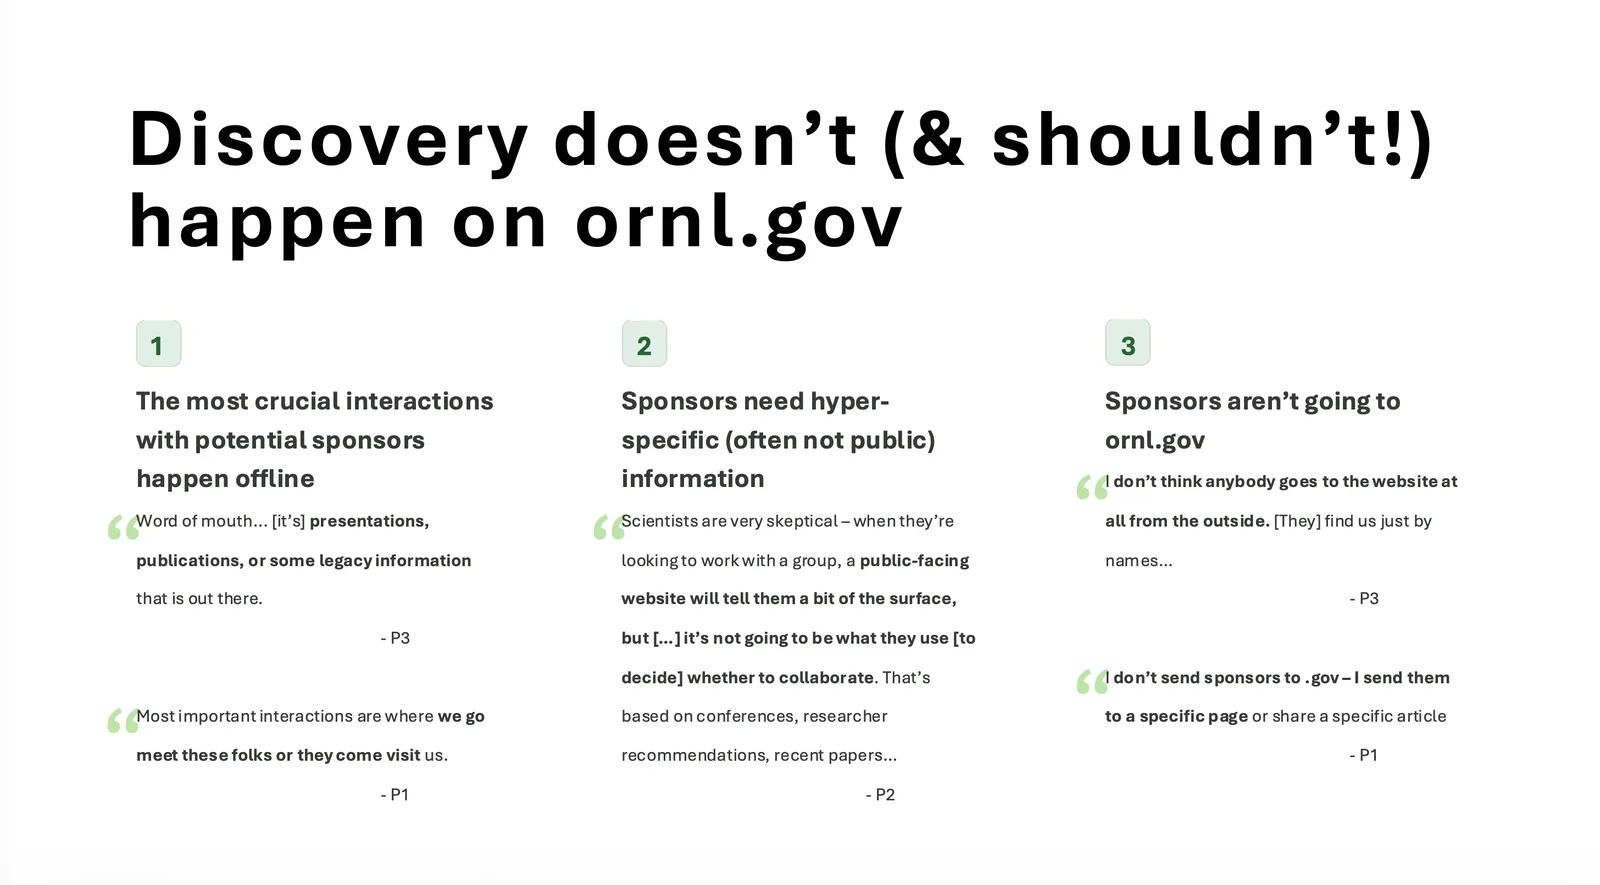
I interviewed people who manage sponsor relationships across federal agencies, state governments, and industry partners. They overwhelmingly told me that sponsors don't evaluate ORNL through the website, and arguably shouldn't: the decisions that matter happen at conferences, through publications, through researcher recommendations, and in person. When staff do use the site with a sponsor, they send one specific link, never the homepage. Further, much of what sponsors actually need is too technical or too specific to ever be public.
This meant "serve sponsors" could not mean building a sponsor acquisition funnel, which is what the team had been heading toward. I reframed the goal: the site's job is to be a credible showcase of the lab's differentiated capabilities and outcomes.
- 06
Testing Navigation
I ran a comparative study on the redesign prototypes, splitting participants between an expansive "mega" navigation and a stripped-down simple one, and testing homepage impressions, focus-area page structure, and wayfinding. The finding overturned an assumption the team had already invested in: users largely ignored the primary navigation entirely, reaching for on-page links and search instead, and rated their own method dramatically easier than either nav design. I recommended adopting the simpler architecture, halting further design investment in the nav, and redirecting it toward on-page pathways and search.
Research Process: Content Editor Experience
- 07
Asking a Question Nobody Had Asked
ORNL.gov's quality is bounded by how easily a small group of content editors can actually publish, and no one had studied them. I ran extended contextual inquiry sessions with editors across roles and experience levels, walking through both creating and updating real content, then ranked every painpoint by how many sessions surfaced it and how severely it slowed the work. The top of that list — no live preview, so every change requires save-and-check — became the anchor for everything that followed.
- 08
Turning Frustration into Baselines
Qualitative painpoints don't survive budget conversations, so I went into the CMS and measured them. I pulled the complete field inventory — hundreds of fields across content and paragraph types — and clustered them to expose how much was functional duplication: a dozen ways to feature content, nearly as many carousels, multiple overlapping image-and-text variants. Then I audited a year of revision histories across the five most-published content types, using a full census where the population was small and confidence-bounded random sampling where it wasn't, to count how many save-check-revise cycles each published page actually cost. That number is the pre-migration baseline. When the new CMS ships with live preview, we can prove the editor experience improved instead of asserting it.
- 09
Shaping the Build
The complexity analysis became an architecture recommendation, not just a finding: don't migrate the CMS one-to-one. Consolidate the sprawl into a small library of configurable blocks, name them by function rather than layout, standardize them across page types, eliminate the ambiguous section containers editors were guessing at, and govern the library centrally so complexity can't quietly regrow. Unmanaged systems accumulate; the recommendation was as much about governance as design.
Main Takeaways
The redesign is being built on an audience strategy leadership explicitly chose, an information architecture its own stakeholders authored, a navigation approach selected by evidence rather than prior investment, and a defined set of baselines that will make the next version falsifiable.
Of the many facets of this project, I am most proud of two: The first is using analytics not to report on a site but to force an unresolved strategic question, then giving leadership a structured way to answer it. The second is the editor track: recognizing that an internal audience nobody had scoped was the real constraint on public quality, then going into the database to convert their frustration into numbers that could survive a budget review. Working across analytics, facilitation, usability research, measurement design, and CMS architecture on a single program demonstrates that I can operate as a strategic partner across UX, content, and engineering in a complex organization.