Oak Ridge National Lab · APP SCORECARD
How might we measure health across an application portfolio?
ORNL runs hundreds of custom internal applications, and until last year no one could compare their health on a common scale. I designed and built the Application Scorecard, a recurring measurement program that scores every app on UX, accessibility, and technical quality, then translates that signal into the language leadership already uses for resourcing and risk. What started as a request to evaluate a few problem apps became a standing governance instrument. The program has now completed its first full annual cycle, giving leadership a repeatable basis for modernization and deprecation decisions instead of a one-time snapshot.
BY THE NUMBERS
- ~200applications with UX & accessibility scores
- 3,500+user voices represented
- 97,000web elements tested for WCAG 2.2 accessibility compliance
- 2+years of continuous rounds of UX & automated accessibility score measuring
- DATE
- Spring 2025 -
- ORGANIZATION
- Oak Ridge National Laboratory
- ROLE
- ResearchStrategyScoring & semantic model designSurvey & pipeline engineeringQuantitative analysis
- DELIVERABLES
- Application Scorecard measurement framework and semantic model, in-app survey instrumentation, automated data pipeline, Power BI dashboard, and per-app UX/accessibility reporting
How was the scorecard developed?
- 01
Identifying the Need for Systematic Evaluation
In collaboration with technical leads and stakeholders, I scoped a need for consistent, comparable evaluation of internal tools across key criteria: usability, accessibility, technical health, and alignment to mission needs. I proposed a modular scorecard to serve both strategic and operational purposes. The result is a repeatable, recurring program rather than a one-off audit.
- 02
Designing the Scoring & Surveying Process at Scale
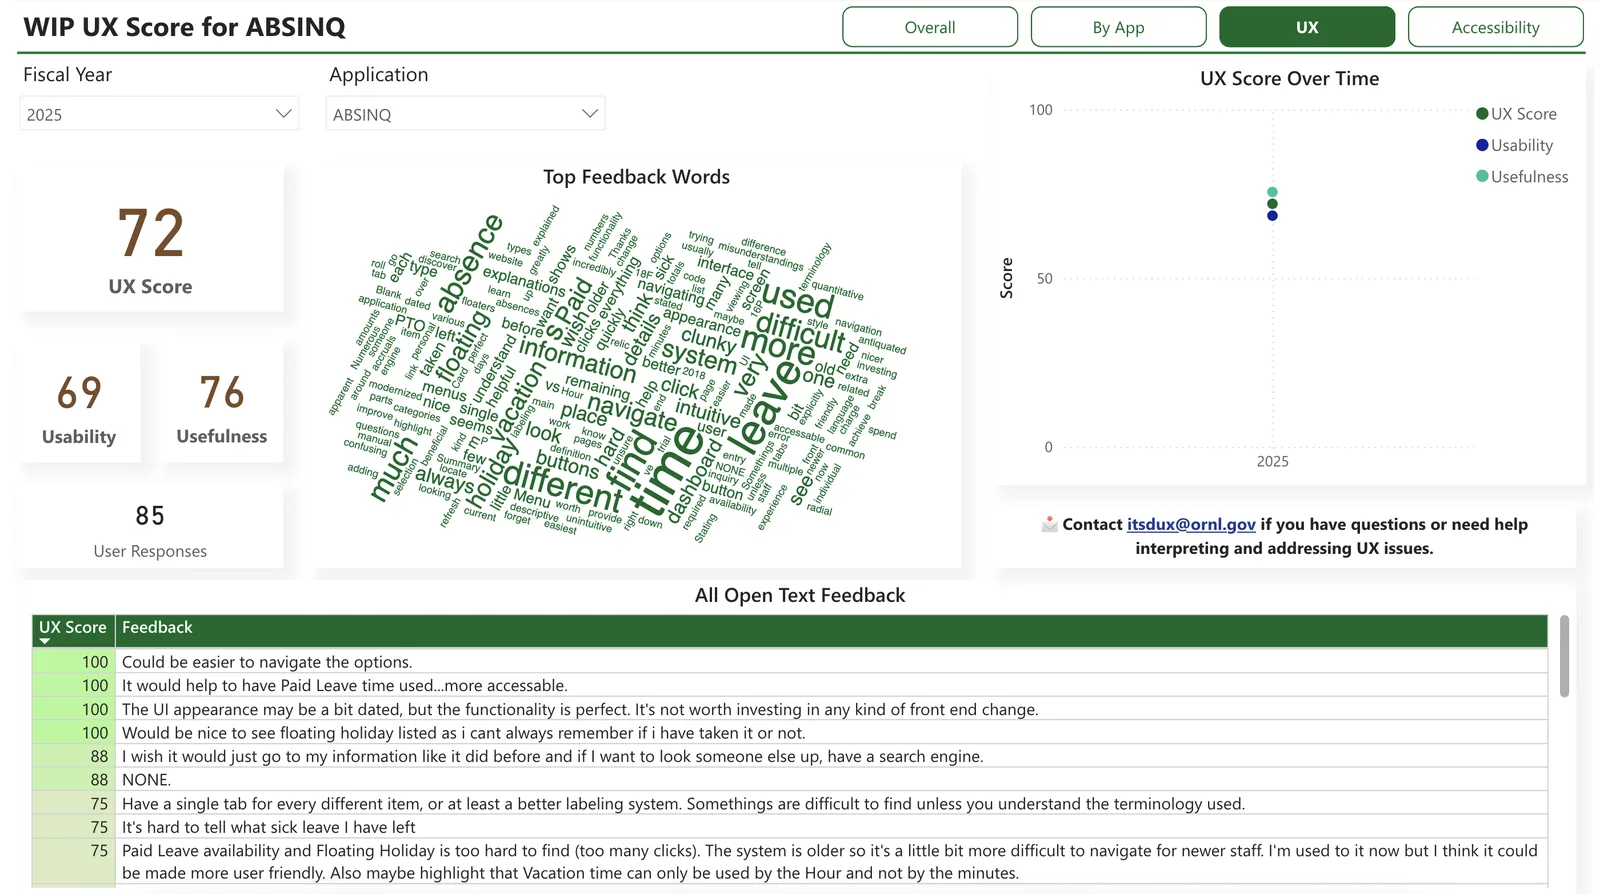
I built the UX scoring model and semantic framework that turns raw survey responses into comparable scores across roughly 200 apps. I also designed the in-app survey and rollout cadence: each app is surveyed once a year, with half the portfolio in the field per cycle, keeping respondent burden low while still producing a full-portfolio view annually. By mid-2026 that had produced over 3,000 responses.
- 03
Automating Accessibility
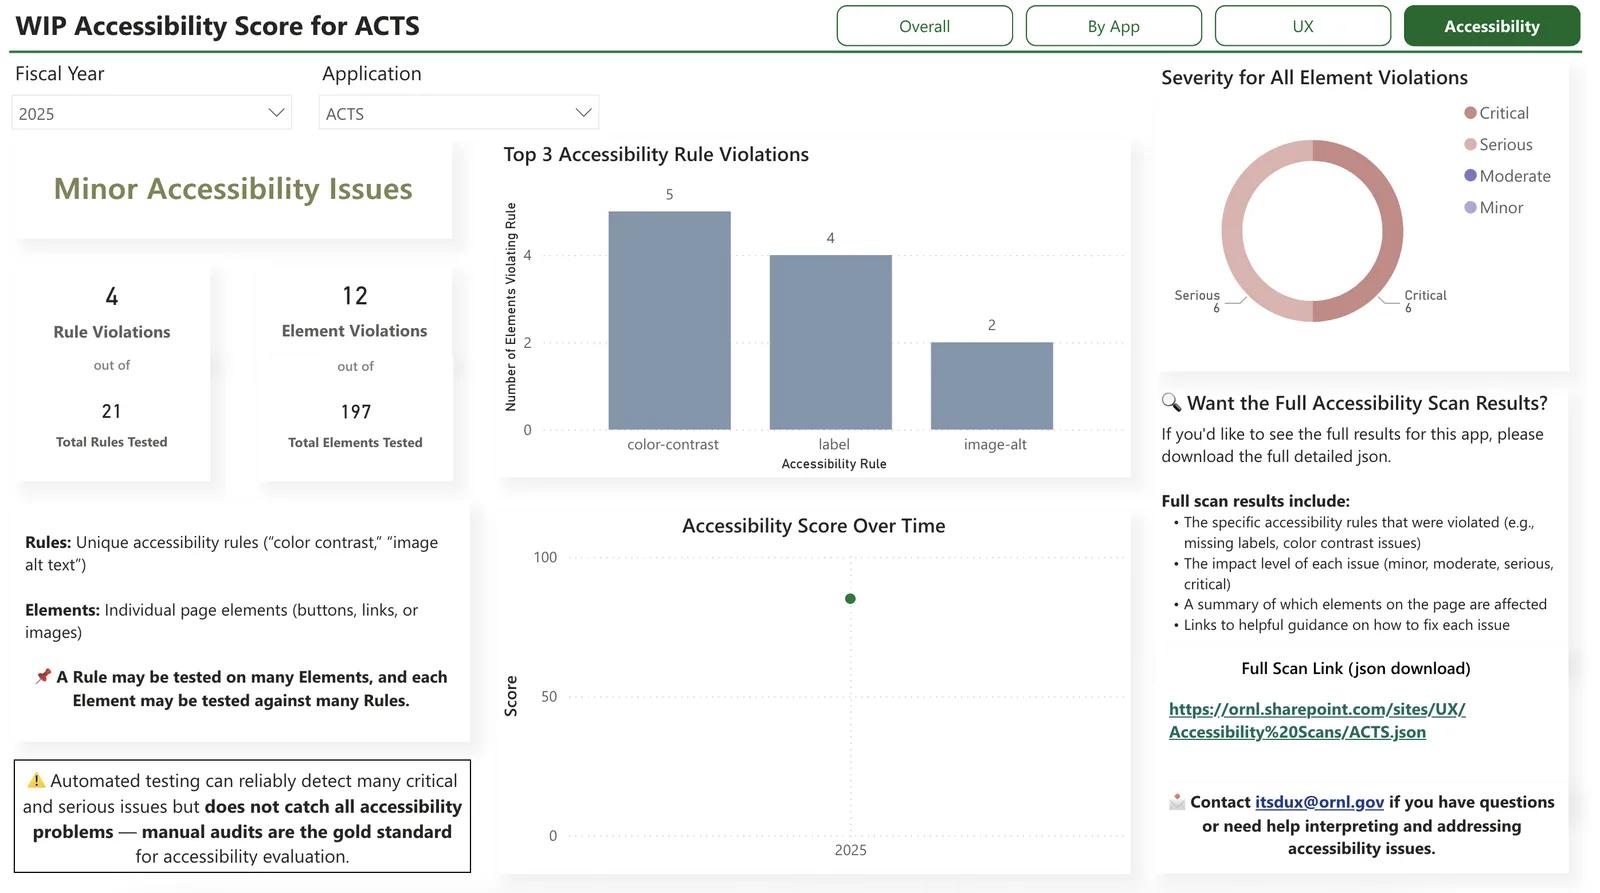
I worked with an accessibility specialist to define the criteria, then wrote the automation: JavaScript scripts that run standardized accessibility tests across the portfolio, since manual audits would never have scaled past a handful of apps. I also collaborated with DevOps and IT to explore performance and security indicators for a future technical health score.
- 04
Turning Scores into Leadership Decisions
Scores only matter if someone acts on them, so I built lightweight reporting templates and a Power BI dashboard that surface findings to app teams and leadership together. The goal was resourcing conversations, not report-reading: which apps to redesign, modernize, or retire, argued from comparable evidence instead of anecdote.
Main Takeaways
The scorecard has moved from a proposed framework to a program leadership uses to decide where to invest. Every app on the portfolio now carries at least one comparable, repeatable score, the difference between an audit and an instrument.
Designing the scoring logic, writing the automation, and shipping this across a lab-wide portfolio of roughly 200 apps shows I can build measurement systems that hold up at scale, not just single studies. That capability transfers to any organization that needs to make technical and experience quality legible to the people funding it.