Eventbrite · EVENTBRITE QUANT UXR PROGRAM
How might we give a whole company statistically sound answers about its users?
In 2022, I joined Eventbrite as its first quantitative UX researcher. In under a year I built the program from nothing: intake, tooling, sampling, and the statistical analysis research hadn't been doing before. It answered 1,000+ stakeholder questions with 50+ surveys sent to 1M+ users.
BY THE NUMBERS
- 1,000+Questions about our users received from stakeholders and processed
- 50+Email and intercept surveys launched & analyzed to answer stakeholder questions
- 1M+Users surveyed
- 15,000+Survey responses
- DATE
- Spring - Fall 2022
- ORGANIZATION
- Eventbrite
- ROLE
- Research operationsDesignStrategyData analysis
- DELIVERABLES
- Jira intake and tracking, a single survey platform (Qualtrics), survey-writing training, a longitudinal feature benchmark with a Tableau dashboard, results decks
How was the program developed?
- 01
Learn what teams needed
I interviewed 10 stakeholders across research, design, marketing, product leadership, and data engineering, and reviewed past surveys. Two needs stood out: knowing where and when surveys ran, and sampling users without over-surveying them.
- 02
Build infrastructure
I moved all survey work onto Qualtrics, set up intake and tracking in Jira, and logged every user's research contact so I could rest them between studies. I also wrote training on when a survey is the right method and how to write good questions.
- 03
Run the studies
For each request, I refined the plan with the stakeholder, found validated scales in the literature where they existed, and wrote SQL to pull qualifying participants. I fielded by email or page-targeted intercept, analyzed in R and Python, and delivered recommendations backed by statistics. When a survey was the wrong tool, I pointed teams to a better method.
- 04
Make it self-serve
Teams wanted to track metrics over time, so I built a longitudinal feature-satisfaction benchmark. Its Tableau dashboard let teams explore scores and the open-text reasons behind them without waiting on a researcher.
Method highlight
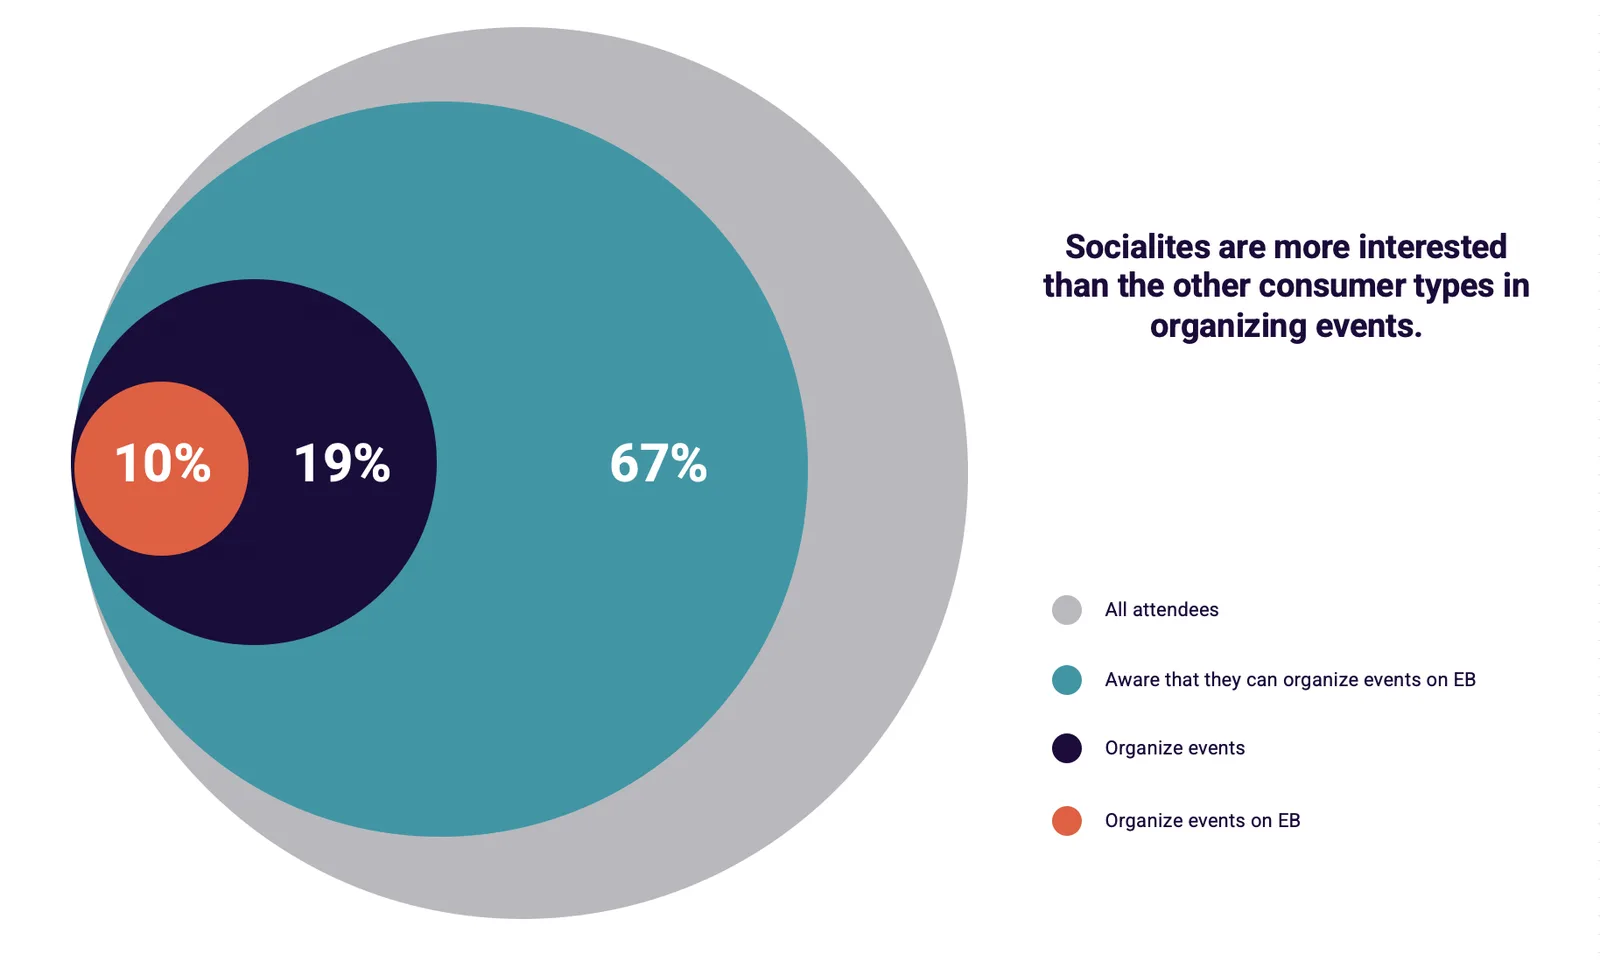
I often used quant to validate and extend qual work. "Socialites" was an archetype hypothesized from a jobs-to-be-done framework; I validated it quantitatively, then used it to show how findings differed by user type.
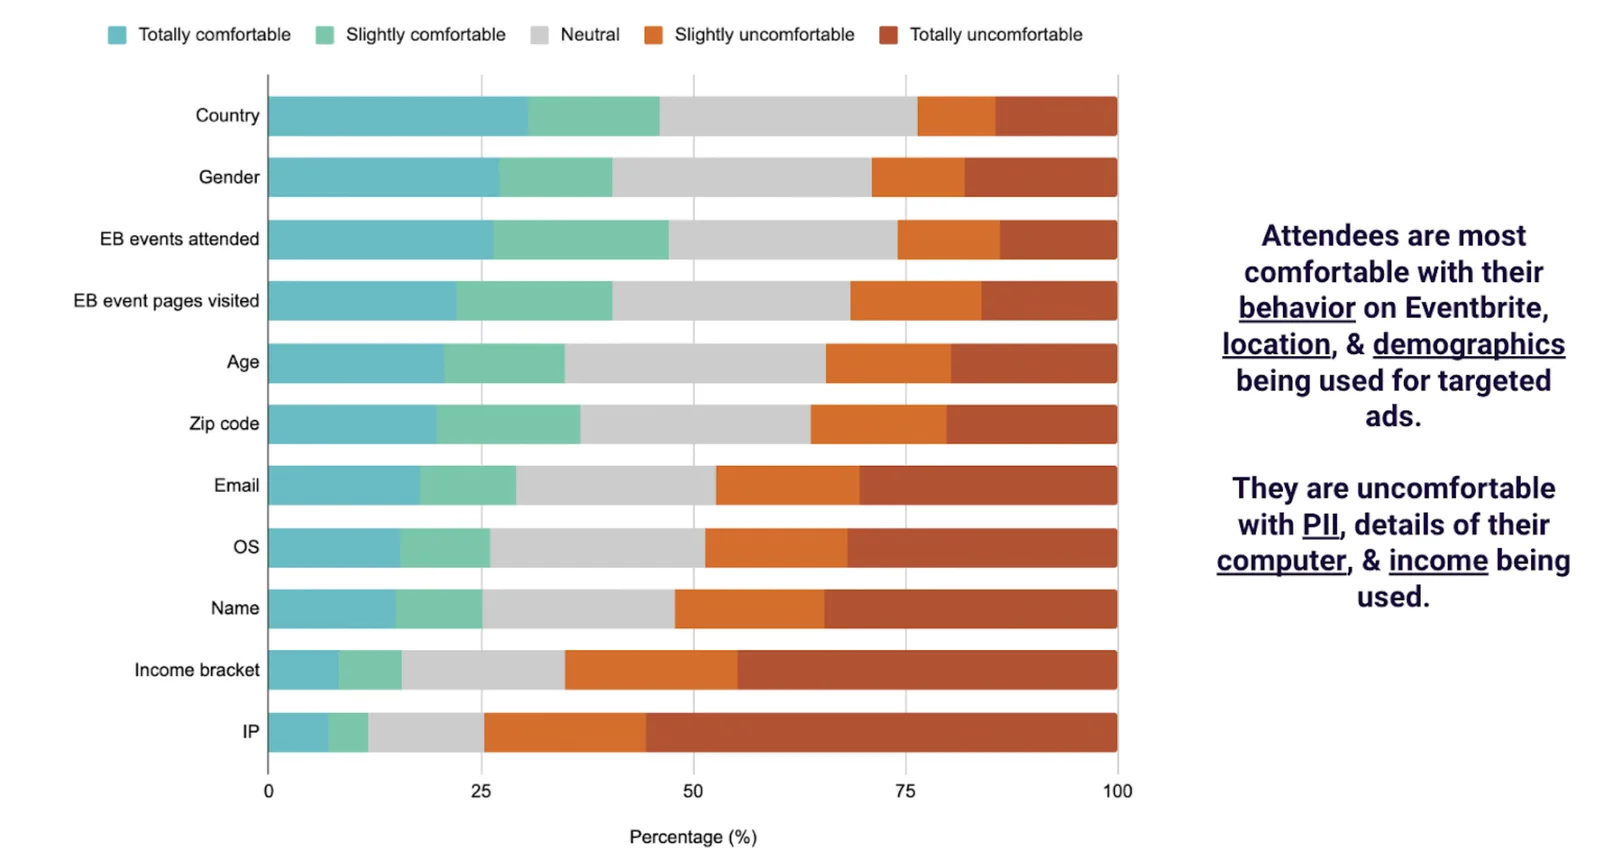
For ad-targeting comfort, I used an existing validated scale, which set the analysis: exploratory factor analysis, reliability of the resulting factors, then MANOVA.
Eventbrite went from scattered, untracked surveys to one program that logged every request, protected users from over-surveying, and backed recommendations with statistics.
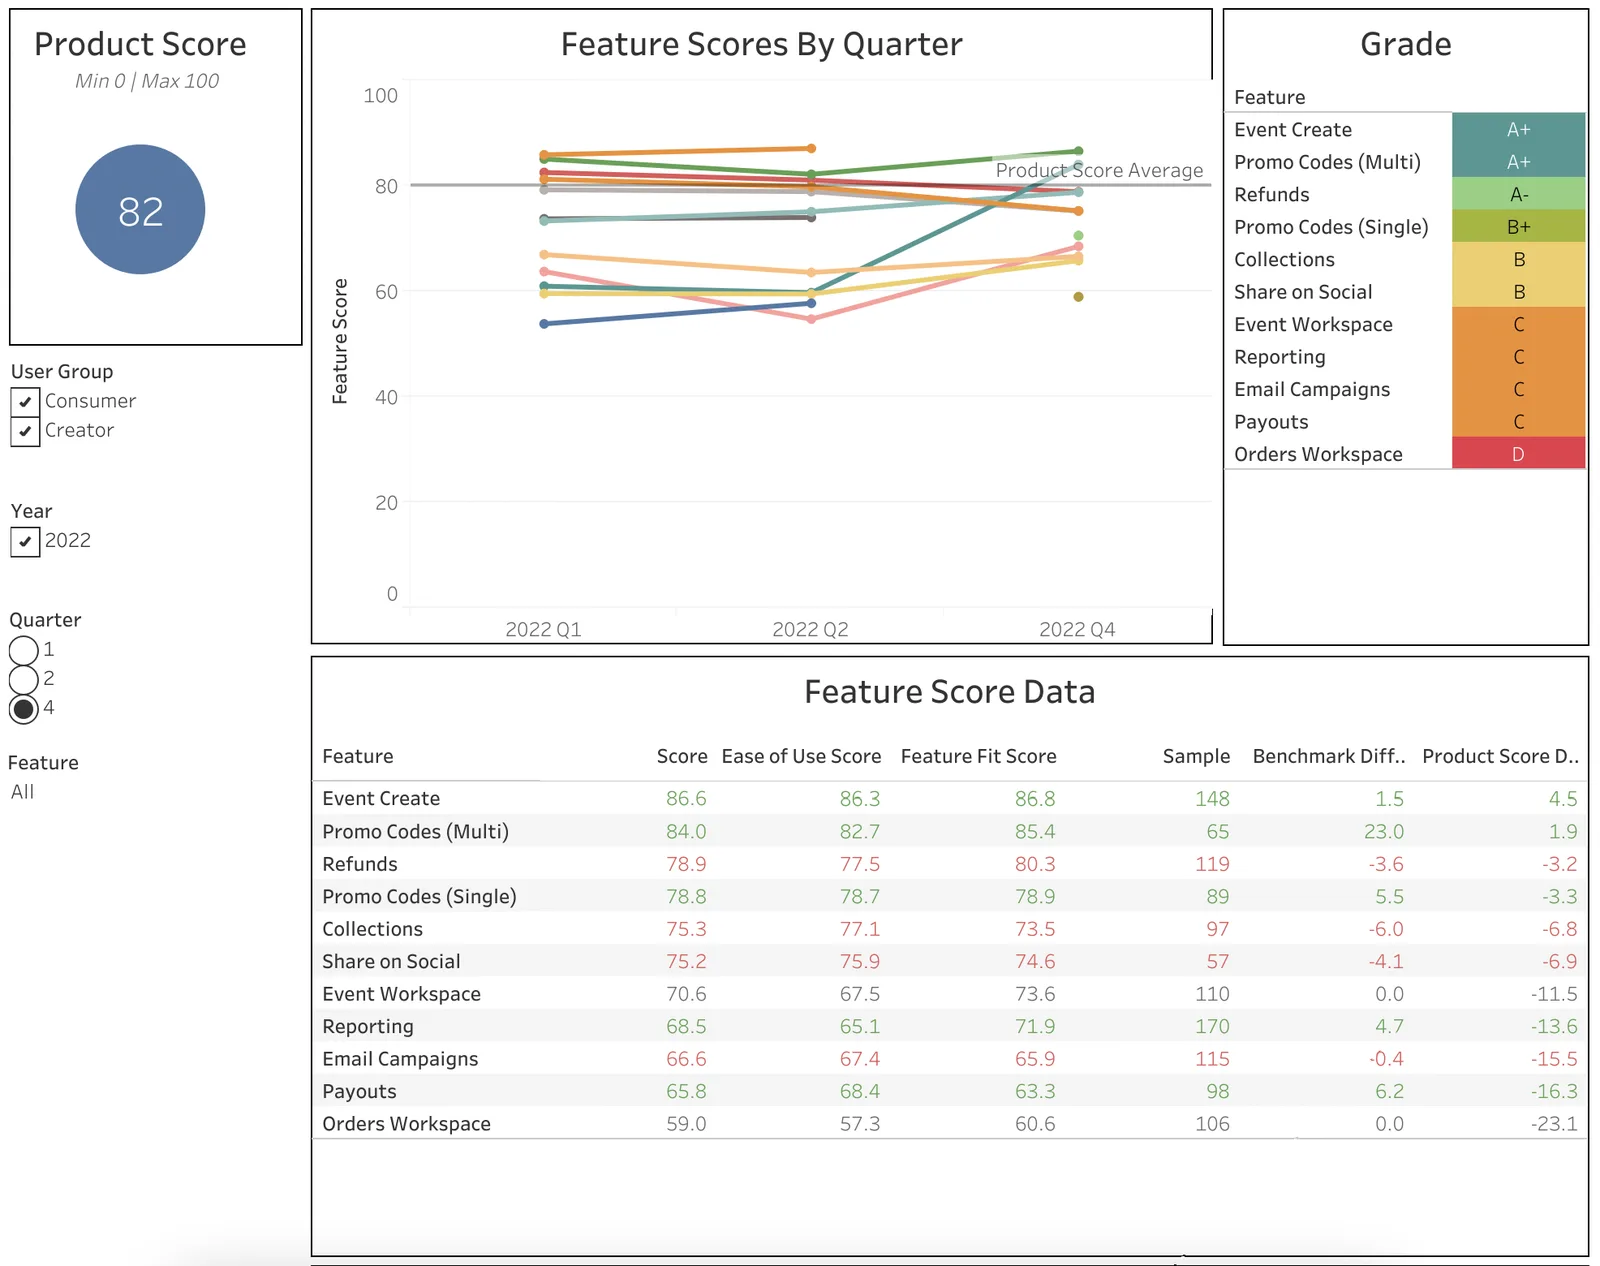
Additionally, I implemented a longitudinal UX benchmarking effort that measured user satisfaction with features over time.
Developing a quantitative research program is hard. Developing a quantitative research program that consistently captures, robustly analyzes, and synthesizes insights with the rigor of statistical modeling is even more difficult. … I can't overstate how much of a pleasure it was to work with Jess, and how much the team and myself were upleveled by the quality and depth of experience Jess brought.