Eventbrite · TRAFFIC REPORT
How might we help event organizers manage their events?
The Reports section of Eventbrite allows users to monitor event metrics (e.g., ticket sales), and my ambiguous task was to determine how we might leverage this space to increase adoption of our marketing bundle. After synthesizing the sparse relevant research, we discovered that most users considered Reports too confusing and difficult to use, suggesting we needed to start with generative work before ideating tangible solutions.
BY THE NUMBERS
- 10users interviewed
- 3users, plus the Voice of Consumer council, in concept testing
- 2prototypes designed and tested
- 20participants in unmoderated user tests
- DATE
- Winter 2022
- ORGANIZATION
- Eventbrite, Reporting Team
- ROLE
- ResearchStrategyDesignContent Design
- DELIVERABLES
- Product recommendations report, design prototypes, user testing results deck, Traffic & Conversion Report, continual feedback reports
Design Research Process
- 01
Generative User Interviews
Following stakeholder interviews and a research review, I conducted 10 semi-structured interviews with a representative group of users. Recommendations, including the opportunity to show users how the metrics they care most about are related to Eventbrite marketing channels, were identified based on thematic analysis of interview data.
- 02
Card Sort & Prototype Concept Testing
Building on these findings, I worked with designers and engineers to create an initial report prototype showing how marketing channels relate to metrics and tested the concept with 3 users and our internal Voice of Consumer council. I also ran a simultaneous card sort experiment to identify the language and channel groupings that were understood best by users.
- 03
User Testing & Design Refinement
Based on these initial results, I then collaborated with design and engineering to create 2 prototypes. I then designed and ran unmoderated user tests with 20 participants to:
- Verify that users understood how to use the report
- Verify that users understood the content
- Test whether users can correctly interpret the graph
- Determine which design variant is easier to use
- 04
Passive User Feedback
After making design changes based on the user testing results and launching the report, we wanted to get continuous feedback on user suggestions and issues. To accomplish this, I set up a feedback tab survey on the new page, as well as tracking of user journeys and conversion funnels in FullStory.
User Testing
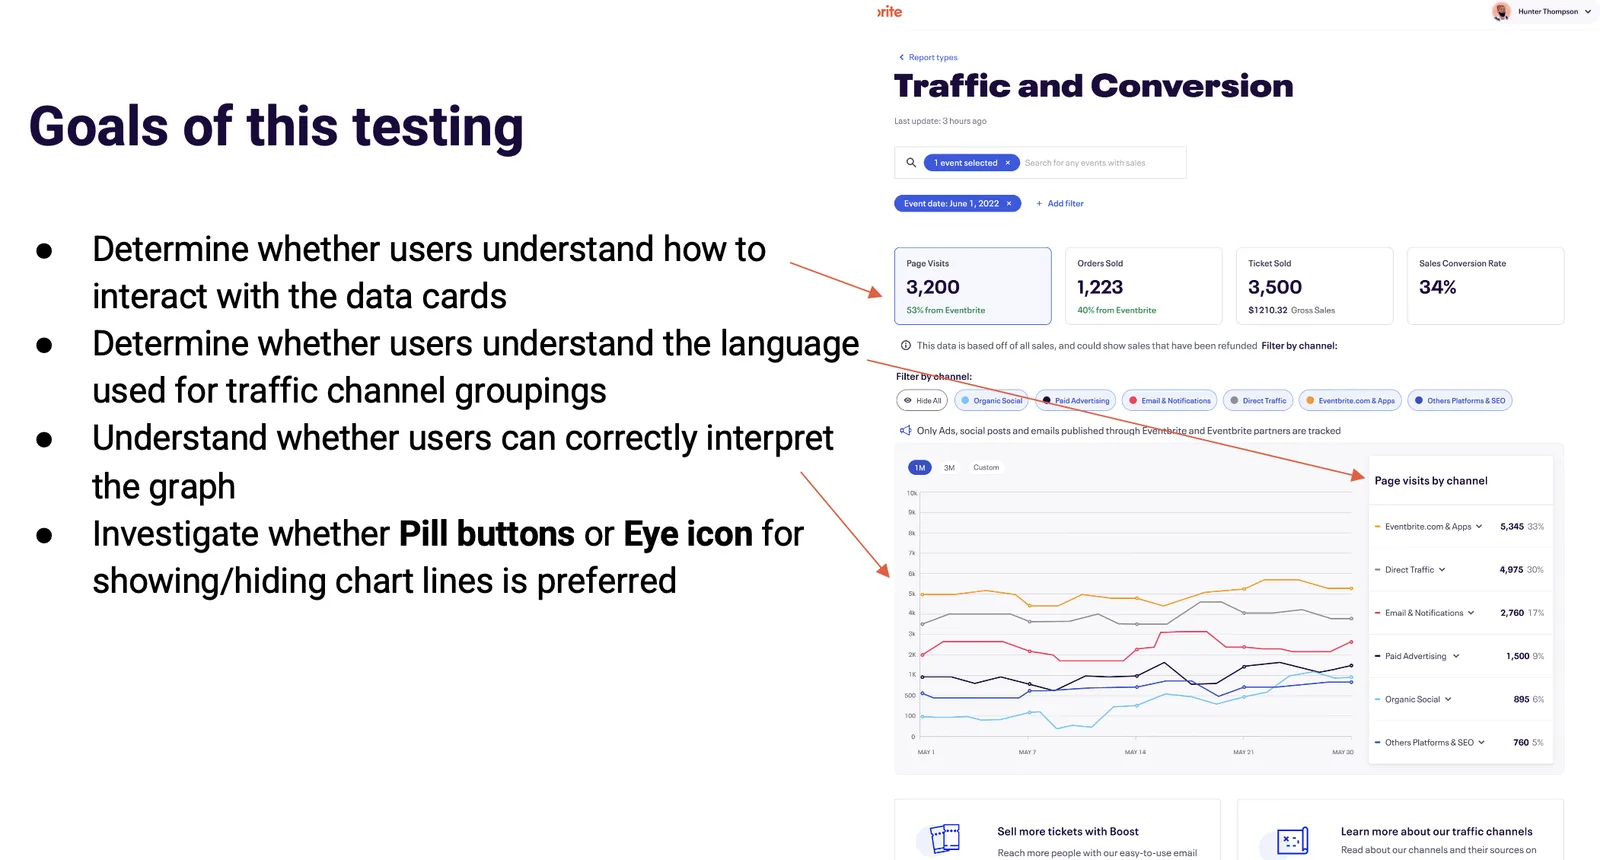
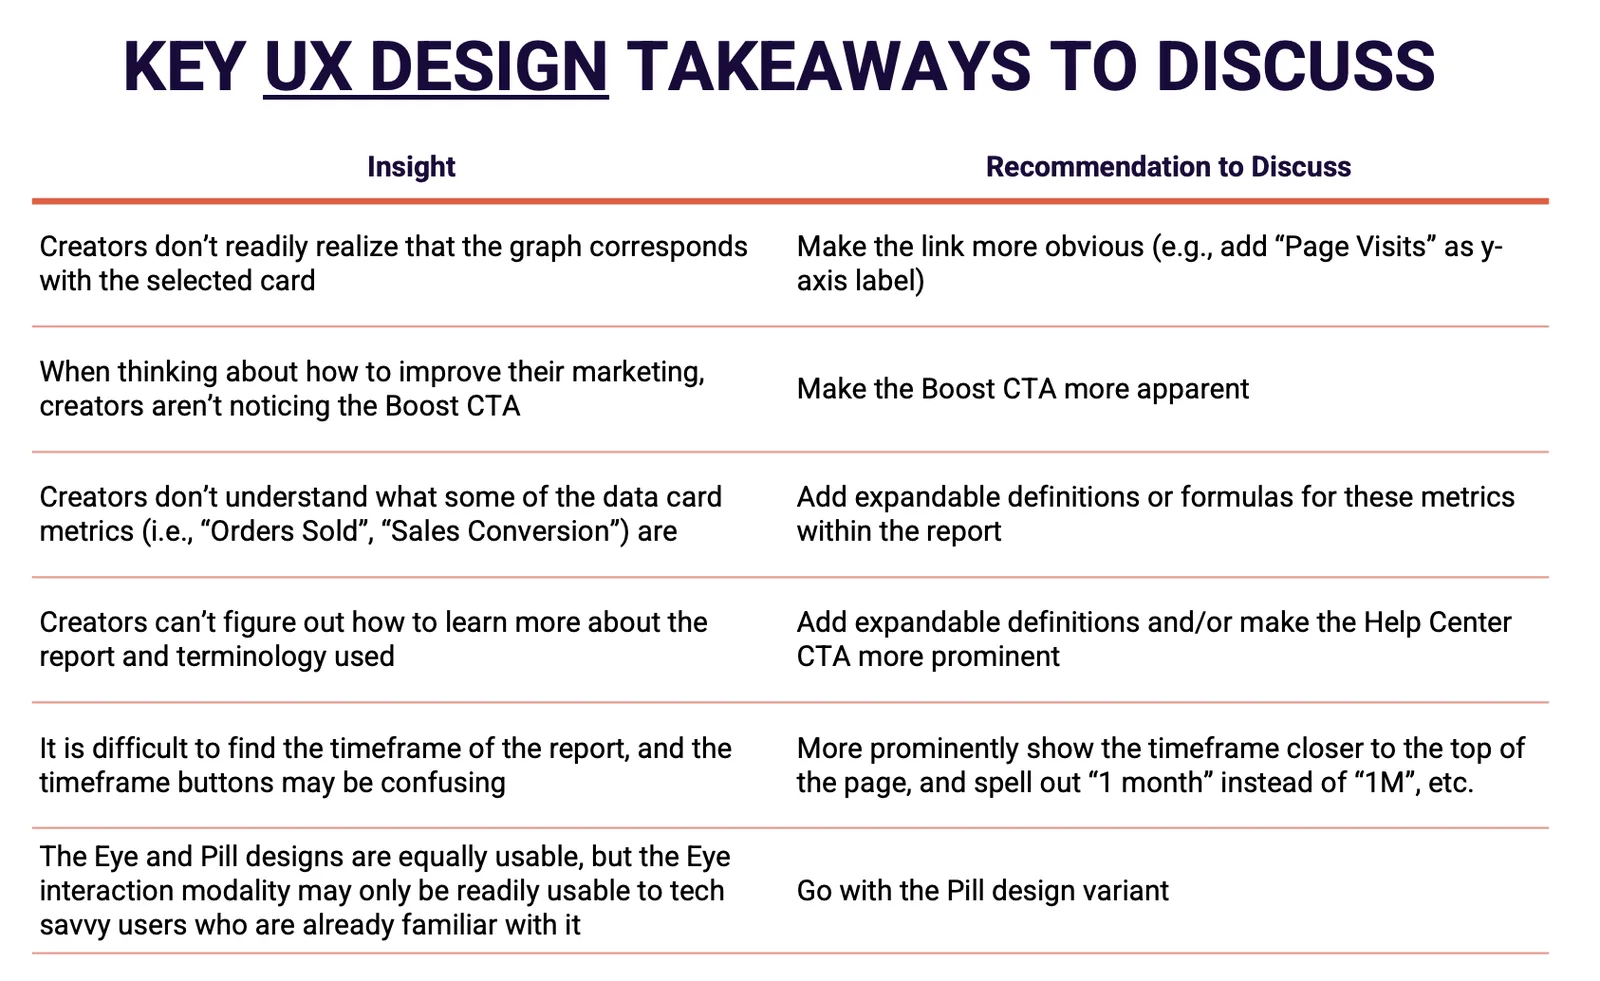
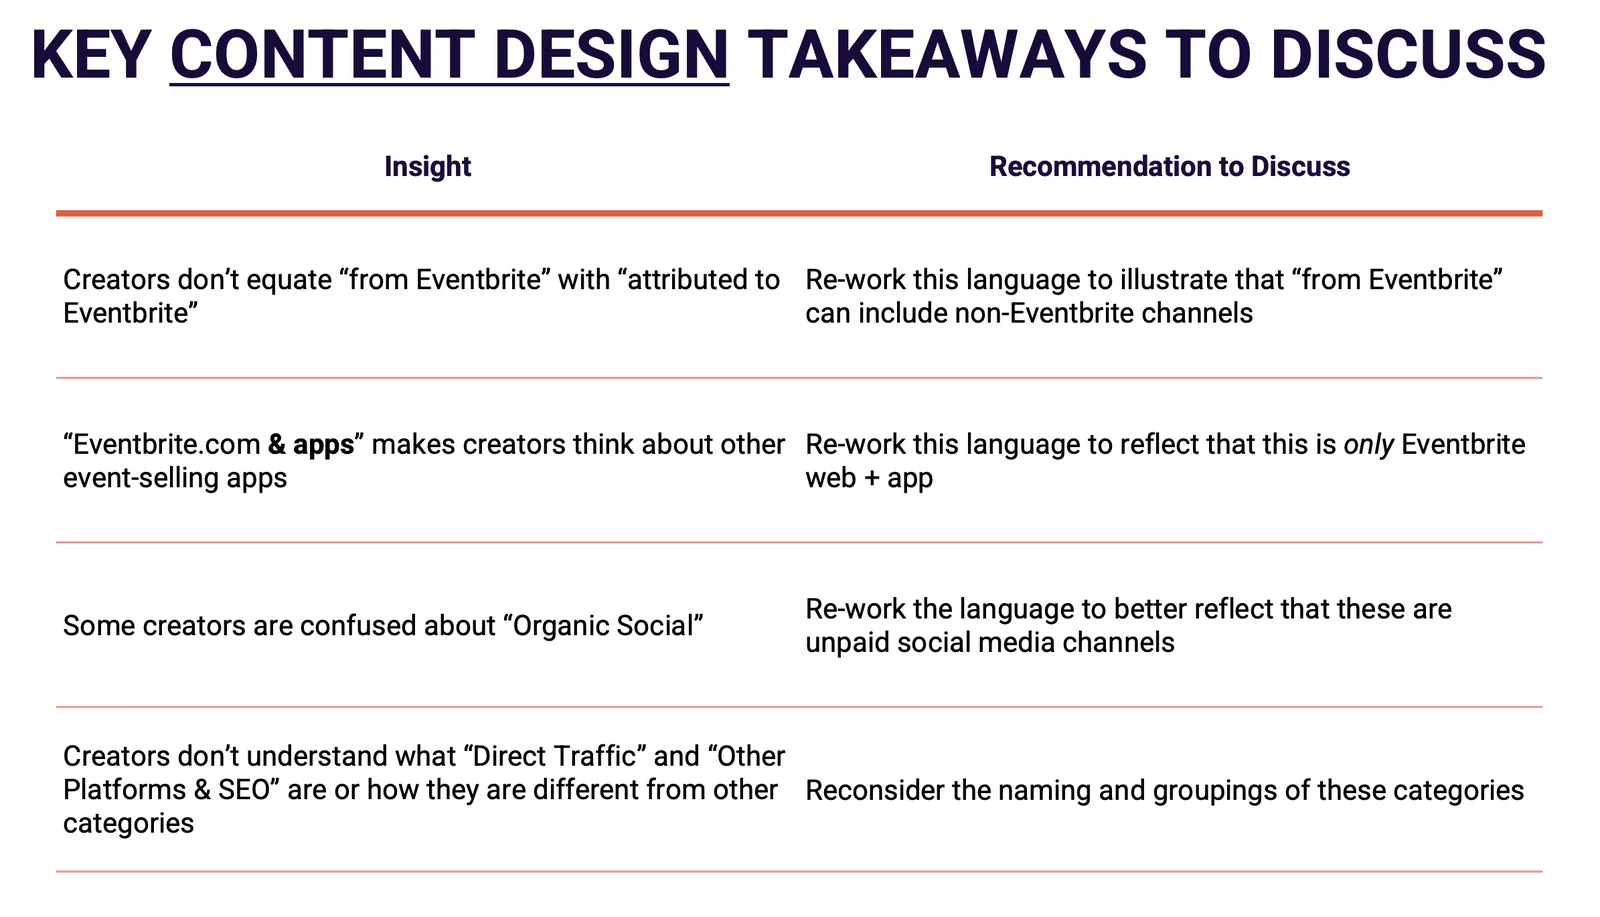
User testing directly resulted in changes to the UX and content design.
Launched Final Design
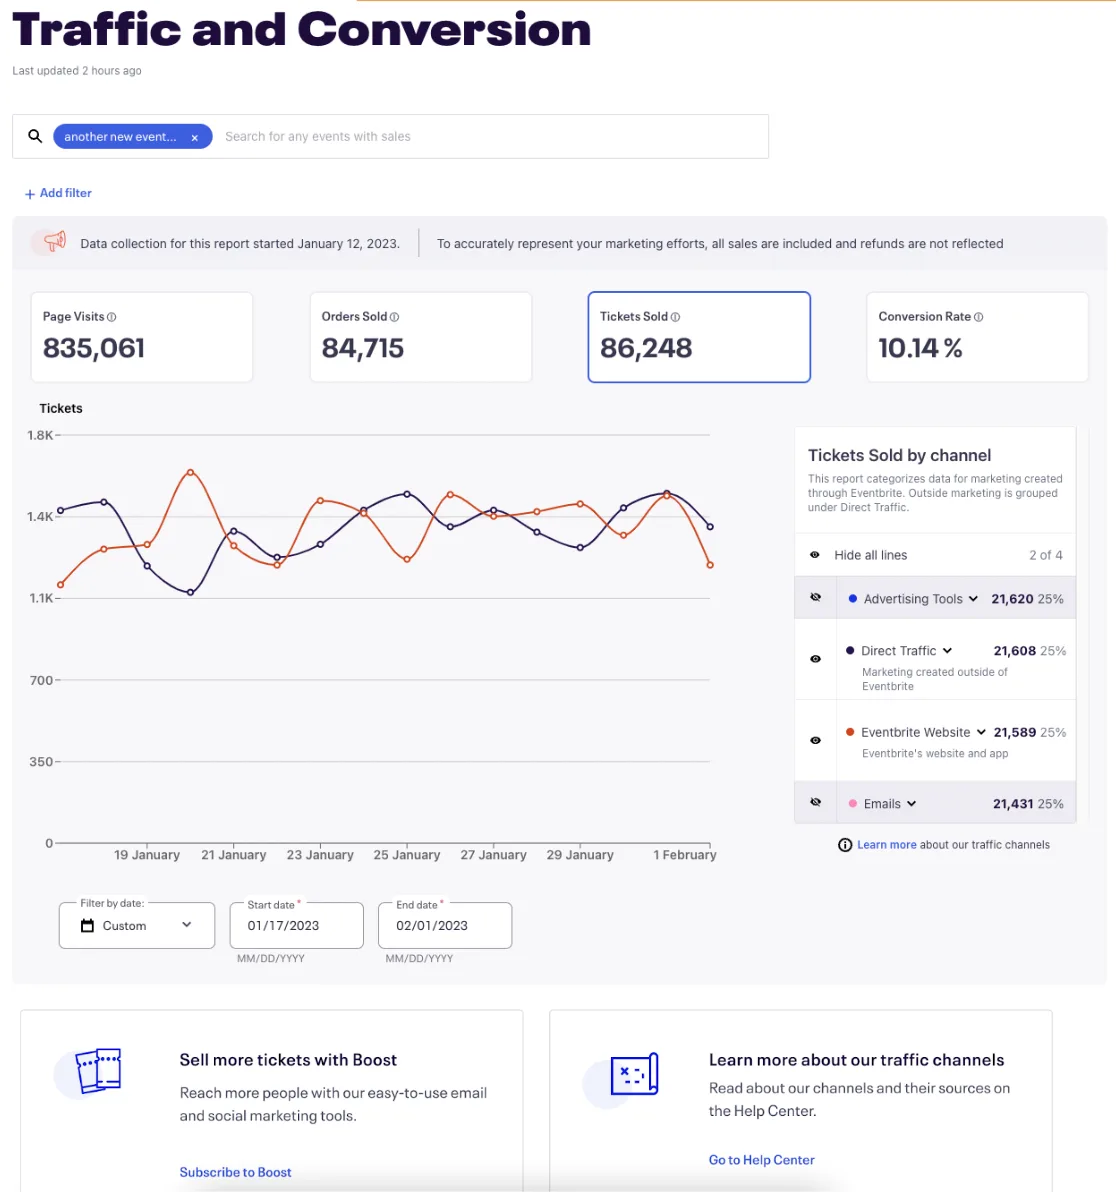
Our design research process resulted in the release of the Traffic and Conversion report, which:
Allows users to easily monitor and understand visits to their event pages and see how people found them
Shows which marketing channels drove the most ticket sales, highlighting the benefit of Eventbrite channels
Contains validated content and UX design elements that resonate with users
Gathers continuous feedback from users about the new report